3. Technical Basis
Overview
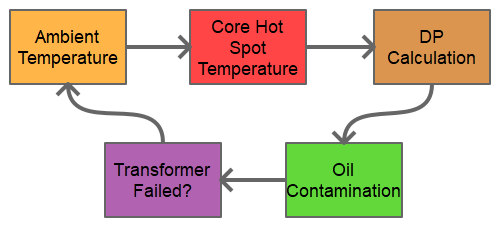
First, the ambient temperature will be estimated based on the current month and the monthly lows, averages, and highs specified by the user. Per day, it is assumed that the transformer experiences 6 hours at the low temperature, 12 hours at the average temperature, and 6 hours at the high temperature.
Next, the core hot spot temperature, paper insulation damage. and oil contamination is calculated. The core hot spot temperature requires the ambient temperature and overload ratio as inputs. The paper insulation degradation module will use the core hot spot temperature to assess the damage to the paper insulation. The oil contamination module will take the current DP of the paper insulation and find the total accumulated CO and CO2.
Finally, the simulation must assess whether the paper insulation of the transformer has failed or not. Rather than set a “hard” threshold at 150 DP (as recommended by Emsley), the simulation was designed to give the paper insulation a probability to fail at values between 150 DP and 250 DP, resulting in a “soft” distribution of failures.
The transformer simulation contains three primary modules:
- Core hot spot
- Paper insulation degradation
- Oil contamination
The following sections will provide more detail about each module.
Core Hot Spot
The degree to which paper insulation is degraded depends on the stress it receives from ambient heat. The “core hot spot” temperature of a transformer is the hottest temperature generated by the windings, and it represents the “weakest link” of the paper insulation. The simulation will only consider the probability that the part of the paper insulation closest to the core hot spot will tear, since it is at the point of highest stress.
The core hot spot temperature is not usually measured directly, but it can be inferred from the ambient temperature using empirical relationships. The equation used for this simulation is described in the paper “Loading Transformers By Temperature” [Montsinger]:
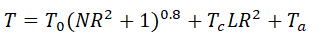
Where T is the total core hot spot temperature, T0 is the temperature rise over the ambient oil temperature, N is the copper to iron loss ratio, R is the ratio of the overload to the rated load, Tc is the temperature rise of the windings over the oil, and L is a known constant. All temperatures are in Celsius.
Paper Insulation Degradation
The degree of polymerization (DP) of the paper insulation is one of the best indicators of its tensile strength. When first manufactured, the DP of paper insulation will typically be between 1000 and 1300. At paper insulation failure, its DP is reduced to about 20% of its starting value, and DP below 150 is almost guaranteed to fail immediately.
The general law of paper insulation degradation over time is given by [Emsley]:
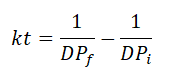
Where k is a constant that depends on the core hot spot temperature and physical characteristics of the transformer, t is the time in hours, DPf is the degree of polymerization of the paper after t hours, and DPi is the initial DP of the paper before t hours.
Oil Contamination
Damage to the paper insulation will release dissolved gas byproducts (such as hydrogen, carbon monoxide, and carbon dioxide) in the insulating oil. These dissolved gases are condition indicators, correlated with the amount of degradation that the paper insulation has experienced.
For the oil contamination module, several papers were used to simulate the accumulation of carbon monoxide and carbon dioxide in a transformer based on paper insulation DP. Unfortunately, academic papers describing this relationship are limited, and power companies are very protective of their DGA data. Hence, measurements from a paper by [Pradhan and Ramu] were used to create a linear relationship between DP and carbon monoxide/dioxide.
While this relationship may not be entirely accurate, it is good enough for the purposes of this simulation. To account for the random variation in the paper’s data, normally-distributed noise was added in this module based on the standard deviation of the empirical data.
This situation is also commonly modeled using chemical equations as a “physics-of-failure” model. Paper insulation is an organic compound, and its breakdown should result in hydrogen and carbon compounds, etc.
The equations developed from empirical data in Pradhan and Ramu’s paper are:
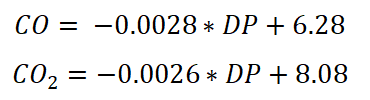
Note that the CO and CO2 values that this function returns are the total accumulation of these dissolved gases over time; it is not the current rate of accumulation.
References
- Montsinger, V. M. “Loading Transformers By Temperature.” AIEE Transactions 49 (1930): 776-79.
- Emsley, A. M., and G. C. Stevens. “Review of Chemical Indicators of Degradation of Cellulosic Electrical Paper Insulation in Oil-Filled Transformers.” IEE Proc.-Sci. Meas. Technol.141.5 (1994).
- Pradhan, M. K., and T. S. Ramu. “On the Estimation of Elapsed Life of Oil-Immersed Power Transformers.” IEEE Transactions on Power Delivery 20.3 (2005).